Pages

Showing posts with label Forex Technical Analysis. Show all posts

Saturday, May 21, 2011

Use of Fibonacci Studies in Technical Analysis


As the series of Fibonacci numbers continues, it's interesting to not that any given number is 1.618 times greater than the preceding number and 0.618% of the next number. For example:
(34/55 = 55/89 = 144/233 =0.618) (55/34 =89/55 =233/144 =1.618), and 1.618 =1/0.618.
These same properties of the Fibonacci series occur throughout nature, science and math. The number 0.618 is often referred to as the "golden ratio", since it is the root of the following polynomial: x^2+x-1=0 which can be rearranged to x= 1/(1+x).
So, that's were the fib 0.618 comes from. The other fibs 0.382 and 0.5 commonly used in technical analysis have a less impressive background, but are just as powerful when used in a Technical analysis.
0.382=(1-.618)=(0.618*0.618)
and 0.5 is the mean of the two numbers.
Other neat fib facts (0.618*(1+0.618)=1 and (0.382*(1+.618))=0.618.

Use of Fibonacci Studies in Technical Analysis

Technical Analysis commonly involves the use of Fibonacci numbers with or without any knowledge of the Elliot Wave to help determine potential resistance or support and price objectives. Retracements of 38.2% commonly suggest that the prior trend will continue, 61.8% retracements, generally mean a brand new trend has began to establish itself. Indecision is implied with a 50% retracement, while during healthy trends, 38.2% is considered natural retracements.

ABC's

To determine the price objectives for a natural retracement at 38.2% you simply add the magnitude of the previous trend to the retracement during an upward trend in the market. And, subtract it during a downward market trend. Usually, after a retracement at 38.2%, the stock should peak the prior swing point (B) on heavier volume. It there is no volume, the magnitude of the move is usually diminished, especially if the volume is very low.
A-B =C-D when B-C =38.2% of A-B

Friday, May 20, 2011

double bottom

A double bottom refers to a lower rate at which the currency had declined to twice, but failed to penetrate. Generally, the asset will trade within that range, but if a breakout occurs, it can be expected to be a substantial move.

Example of "double bottom" figure

Thursday, May 19, 2011

Rate-of-change (percent)

The Rate-of-Change (percent) is a momentum oscillator that measures the percent change in price from one period to the next. A 10 period rate of change would be calculated as follows:
ROC = 100*(Close-Close 10 periods ago)/(Close 10 periods ago)
The plot forms an oscillator that fluctuates above and below the zero line as the rate-of-change moves from positive to negative. The oscillator can be used as any other momentum oscillator by looking for higher lows, lower highs, positive and negative divergences, and crosses above and below zero for signals.

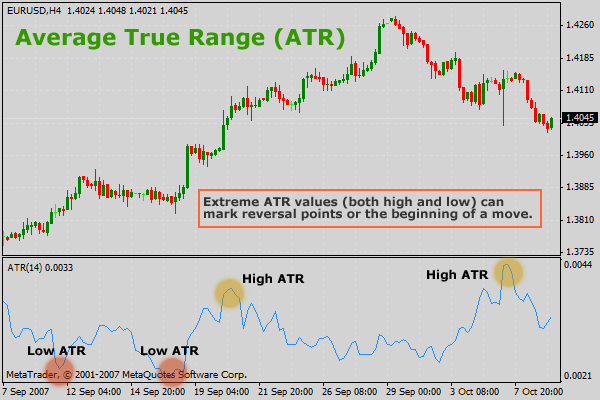
ATR ("Average True Range")

Developed by J. Welles Wilder and introduced in his book, New Concepts in Technical Trading Systems (1978), the Average True Range (ATR) indicator measures a currency’s volatility. Wilder defined the true range (TR) as the greatest of the following:
  • Current high less the current low.
  • The absolute value of: current high less previous close.
  • The absolute value of: current low less previous close.
The method of calculation ensures that significant gaps accompanied by small high/low ranges are not excluded when measuring volatility. The last two possibilities arise when the previous close is greater than the current high (potential gap up) or lower than the current low (potential gap down). Absolute values were applied to differences to ensure positive numbers.
Typically, ATR is based on 14 periods and can be calculated on an intraday, daily, weekly or monthly basis. The first 14-day ATR value is a simple average of the last 14 daily ATR values. Subsequent calculations would smooth the indicator by including the previous 14-day ATR value when calculating the current day’s ATR value.

Moving Average Convergence/Divergence (MACD)

Developed by Gerald Appel, Moving Average Convergence Divergence (MACD) is one of the simplest and most reliable indicators available.  The Moving Average Convergence/Divergence (MACD) indicator is calculated by subtracting the 12-period exponential moving average of a given currency or commodity from its 26-period exponential moving average. A 9-period exponential moving average of the MACD itself is usually plotted over this line as a signal or trigger line. By using moving averages, MACD has trend following characteristics. In addition, by plotting the difference of the moving averages as an oscillator, MACD also has momentum characteristics.
There are three techniques commonly used to interpret the MACD:

Divergence: When MACD moves counter to the direction of the currency itself, it is a warning that the currency's trend may change.

Centerline Crossover: Some analysts choose to buy or sell when the MACD goes above or below zero (the centerline).

Trigger line: When the MACD crosses above the slower trigger line, this is a bullish signal. When the MACD goes below the trigger line, it's a bearish signal.

Parabolic SAR

Developed by Welles Wilder, creator of RSI and DMI, the Parabolic SAR sets trailing price stops for long or short positions. Also referred to as the stop-and-reversal indicator (SAR stands for "stop and reversal"), Parabolic SAR is more popular for setting stops than for establishing direction or trend. Wilder recommended establishing the trend first, and then trading with Parabolic SAR in the direction of the trend. If the trend is up, buy when the indicator moves below the price. If the trend is down, sell when the indicator moves above the price.
The formula is quite complex and beyond the scope of this definition, but interpretation is relatively straightforward. The dotted lines below the price establish the trailing stop for a long position and the lines above establish the trailing stop for a short position. At the beginning of the move, the Parabolic SAR will provide a greater cushion between the price and the trailing stop. As the move gets underway, the distance between the price and the indicator will shrink, thus making for a tighter stop-loss as the price moves in a favorable direction.
There are two variables: the step and the maximum step. The higher the step is set, the more sensitive the indicator will be to price changes. If the step is set too high, the indicator will fluctuate above and below the price too often, making interpretation difficult. The maximum step controls the adjustment of the SAR as the price moves. The lower the maximum step is set, the further the trailing stop will be from the price. Wilder recommends setting the step at .02 and the maximum step at .20.

Moving Average

Moving Averages are one of the most popular and easy to use tools available to the technical analyst. By using an average of prices, moving averages smooth a data series and make it easier to spot trends. This can be especially helpful in volatile markets.
A moving average (MA) is an average of data for a certain number of time periods. It "moves" because for each calculation, we use the latest x number of time periods' data.  There are two major types of Moving Averages:  "Simple" and "Exponential".
 
Simple Moving Average
A simple moving average (SMA) is formed by finding the average price of a currency or commodity over a set number of periods. Most often, the closing price is used to compute the moving average. For example: a 5-day moving average would be calculated by adding the closing prices for the last 5 days and dividing the total by 5.
A moving average moves because as the newest period is added, the oldest period is dropped. If the next closing price in the average is 15, then this new period would be added and the oldest day, which is 10, would be dropped. The new 5-day moving average would be calculated as follows:
Over the last 2 days, the moving average moved from 12 to 13. As new days are added, the old days will be subtracted and the moving average will continue to move over time.
moving averages are lagging indicators and will always be behind the price. Because moving averages are lagging indicators, they fit in the category of trend following. When prices are trending, moving averages work well. However, when prices are not trending, moving averages do not work
 
Exponential Moving Average
In order to reduce the lag in simple moving averages, technicians sometimes use exponential moving averages, or exponentially weighted moving averages. Exponential moving averages reduce the lag by applying more weight to recent prices relative to older prices. The weighting applied to the most recent price depends on the length of the moving average. The shorter the exponential moving average is, the more weight that will be applied to the most recent price. For example: a 10-period exponential moving average weighs the most recent price 18.18% and a 20-period exponential moving average weighs the most recent price 9.52%. The method for calculating the exponential moving average is fairly complicated. The important thing to remember is that the exponential moving average puts more weight on recent prices. As such, it will react quicker to recent price changes than a simple moving average. For those who wish to see an example formula for an exponential moving average, one is provided below. Others may prefer to skip this section and move on the comparison of the moving averages.
Exponential Moving Average Calculation

The formula for an exponential moving average is:
X = (K x (C - P)) + P

X = Current EMA
C = Current Price
P = Previous period's EMA*
K = Smoothing constant
(*A SMA is used for first period's calculation)
The smoothing constant applies the appropriate weighting to the most recent price relative to the previous exponential moving average. The formula for the smoothing constant is:
K = 2/(1+N)
N = Number of periods for EMA
For a 10-period EMA, the smoothing constant would be .1818.
The EMA formula works by weighting the difference between the current period's price and the previous period's EMA and adding the result to the previous period's EMA. There are two possible outcomes: the weighted difference is either positive or negative.
  1. If the current price (C) is higher than the previous period's EMA (P), the difference will be positive (C - P). The positive difference is weighted by multiplying it by the constant ((C - P) x K) and the answer is added to the previous period's EMA, resulting in a new EMA that is higher ((C - P) x K) + P.
  2. If the current price is lower than the previous period's EMA, the difference will be negative (C - P). The negative difference is weighted by multiplying it by the constant ((C - P) x K) and the final result is added to the previous period's EMA, resulting in a new EMA that is lower ((C - P) x K) + P.

Standard Deviation

Standard deviation is a statistical term that provides a good indication of volatility. It measures how widely values (closing prices for instance) are dispersed from the average. Dispersion is difference between the actual value (closing price) and the average value (mean closing price). The larger the difference between the closing prices and the average price, the higher the standard deviation will be and the higher the volatility. The closer the closing prices are to the average price, the lower the standard deviation and the lower the volatility.
The calculation for the standard deviation is based on the number of periods chosen. 20 days, which represents about a month, is a popular number of periods to use and will be used in the example below.
The steps for a 20-period standard deviation formula are as follows:
  1. Calculate the mean price. Sum the 20 periods and divide by 20. This is also the average price over 20 periods. (2246.06/20 = 112.30)
  2. For each period, subtract the mean price from the close. This gives us the deviation for each period (-3.30, -9.24….).
  3. Square each period's deviation (10.91, 85.38…).
  4. Add together the squared deviations for periods 1 through 20 (921.28).
  5. Divide the sum of the squared deviations by 20 (921.28/20 = 46.06).
  6. Calculate the square root of the sum of the squared deviations. The square root of 46.06 equals 6.787.
The standard deviation for the 20 periods is 6.787.


Bollinger Bands


Developed by John Bollinger, Bollinger Bands are an indicator that allows users to compare volatility and relative prices levels over a period of time. The indicator consists of three bands designed to encompass the majority of a currency's price action.
  1. A simple moving average ("SMA") in the middle
  2. An upper band (SMA plus 2 standard deviations)
  3. A lower band (SMA minus 2 standard deviations)
Standard deviation is a statistical term that provides a good indication of volatility. Using the standard deviation ensures that the bands will react quickly to price movements and reflect periods of high and low volatility. Sharp increases or decreases in prices, and hence volatility, will lead to a widening of the bands. Long periods of sideways movements will lead to a narrowing.
Bollinger Bands are designed to capture the majority of price movement. When prices move beyond the upper or lower band, they are considered high (overbought) or low (oversold) on a relative basis.

Wednesday, May 18, 2011

Forex Technical Analysis

This article provides insight into one of the two major methods of analysis used to forecast the behavior of the Forex market. Technical analysis and fundamental analysis differ greatly, but both can be useful forecast tools for the Forex trader. They have the same goal - to predict a price or movement. The technical analyst studies the effect while the fundamentalist studies the cause of market movement. Many successful traders combine a mixture of both approaches for superior results.

Technical analysis
Technical analysis is a method of predicting price movements and future market trends by studying charts of past market action. Technical analysis is concerned with what has actually happened in the market, rather than what should happen and takes into account the price of instruments and the volume of trading, and creates charts from that data to use as the primary tool. One major advantage of technical analysis is that experienced analysts can follow many markets and market instruments simultaneously.
Technical analysis is built on three essential principles:
  1. Market action discounts everything! This means that the actual price is a reflection of everything that is known to the market that could affect it, for example, supply and demand, political factors and market sentiment. However, the pure technical analyst is only concerned with price movements, not with the reasons for any changes.
  2. Prices move in trends. Technical analysis is used to identify patterns of market behavior that have long been recognized as significant. For many given patterns there is a high probability that they will produce the expected results. Also, there are recognized patterns that repeat themselves on a consistent basis.
  3. History repeats itself. Forex chart patterns have been recognized and categorized for over 100 years and the manner in which many patterns are repeated leads to the conclusion that human psychology changes little over time.
Forex charts are based on market action involving price. There are five categories in Forex technical analysis theory:
  • Indicators (oscillators, e.g.: Relative Strength Index (RSI)
  • Number theory (Fibonacci numbers, Gann numbers)
  • Fibonacci Studies
  • Gann Tools
  • Channels
  • Waves (Elliott wave theory)
  • Gaps (high-low, open-closing)
  • Trends (following moving average).